
Analyse office occupancy
Monitor and analyse office statistics with FlexWhere
Put your data to good use. Accurate and optimised to help you achieve your best office environment.
Loved by companies around the world


Get the most out of your office space
With the FlexWhere Dashboard, it’s easy to have a clear overview of all office usage, employee preferences and workplace, parking and meeting room occupation. Discover real-time insights, cut unnecessary costs, and make informed decisions for a more productive and optimised work environment.
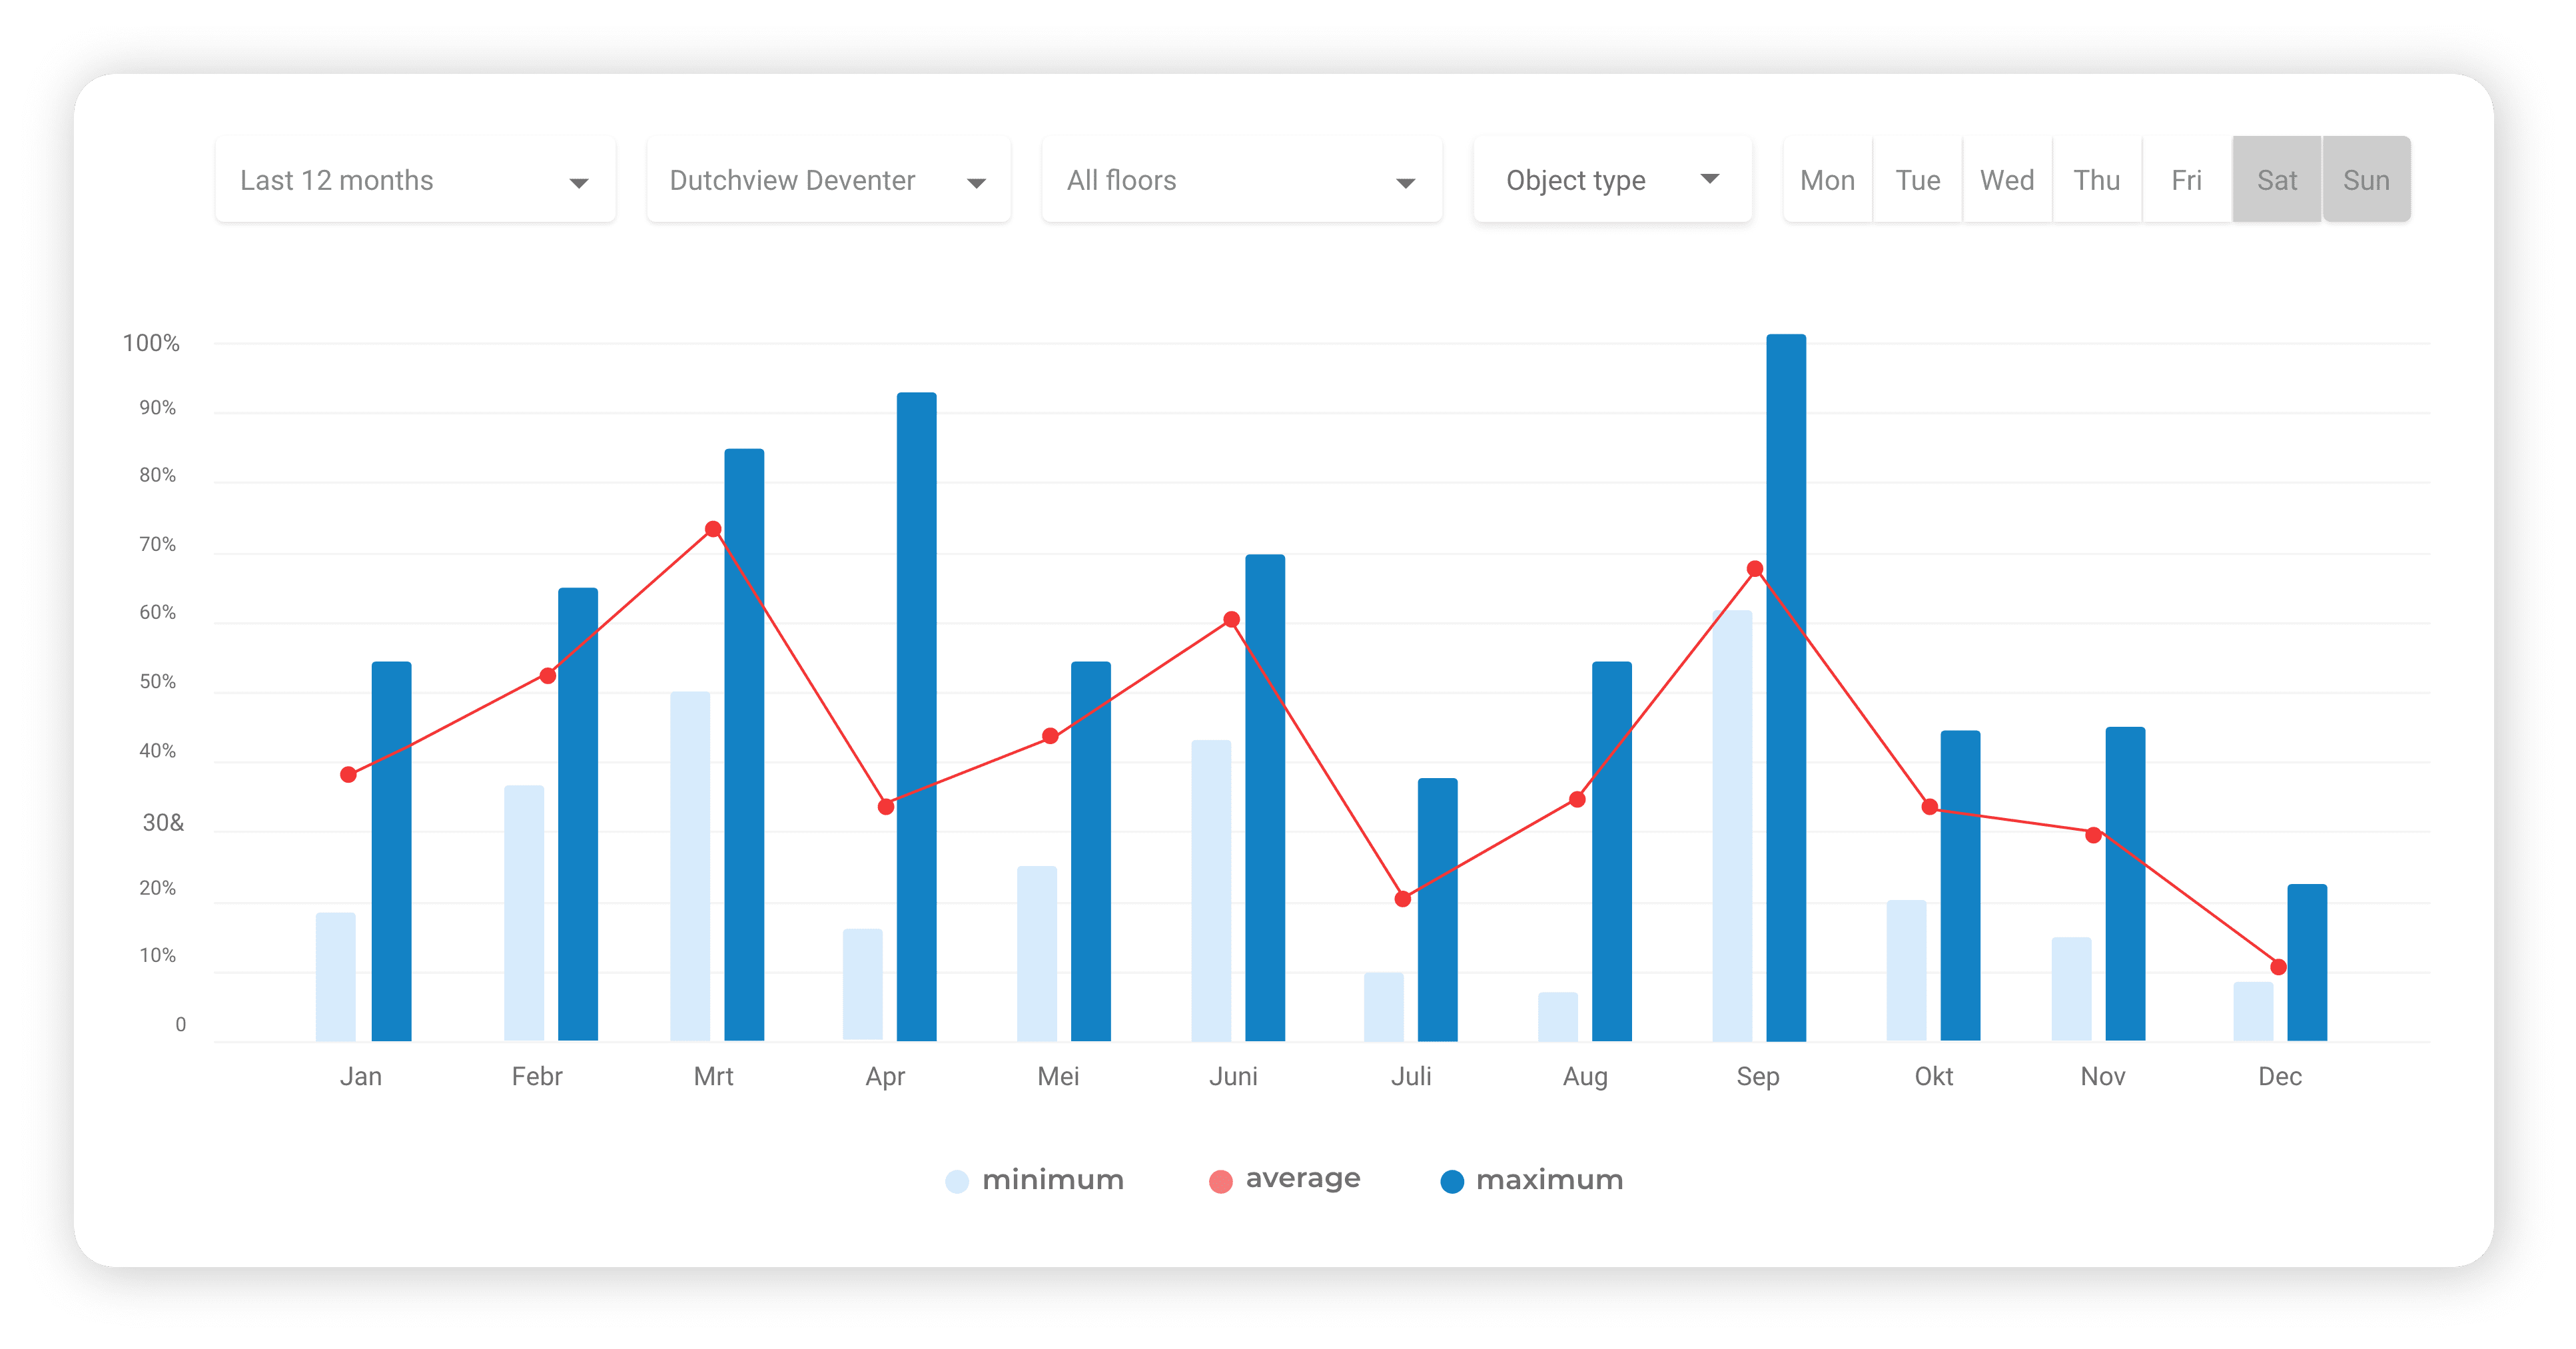
Occupancy Rate Over Time
NEW
See lowest, highest, and average occupancy rates.
Filter on period, office location, floor and days of the week.
Utilise data to manage and improve your office


Know how employees use your office
Discover the preferences and work patterns of employees so you can facilitate their needs.
Knowing what spaces and services make employees come to the office helps facility managers optimise spaces for a more connected environment.


Save on unnecessary costs
Let data guide your decision-making. Make strategic choices that lead to more efficient resource allocation and substantial savings.
Tip: Close your office on certain days of the week based on low occupancy levels, saving overhead costs over time.

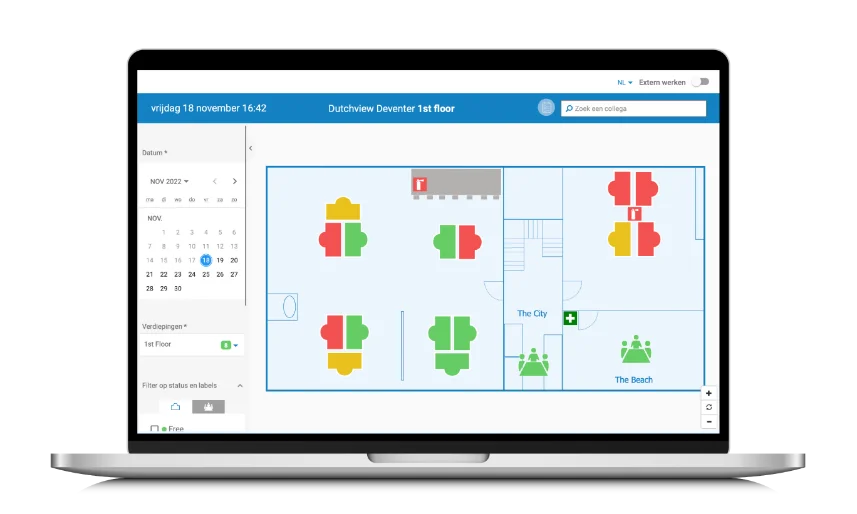
Real-time occupation overview
Actively see how employees are using the office space in real-time, so that you can see if spaces and resources are being used optimally.
Unlock your FlexWhere data today
Assets usage

Visualise your most used assets to see what type of desks, meeting rooms and other assets your employees prefer the most.
Weekly overview

% of your office usage on most and least popular days of the week, be surprised even on the busiest day how much space goes unused 👀.
Real-time stats

Real-time data overview, to see how your employees are using the space, right now!
Heatmap

Easily discover office hotspots or
under-utilised spaces.
Employee and Workplace Changes

Gain insight into the impact of fluctuating employees and workspaces on your occupancy rate.
Reliable data to improve your office space Free demonstration
Power BI
PAID ADD-ON
Dive deeper into data
Add on for £0,25 per user/month (billed annually)
Power-BI is available as an add-on integration to the FlexWhere dashboard. It is updated with your FlexWhere data and provides an even more detailed view such as:
Hourly occupation rates
Comparisons between floors, desks, premises
Unused workplace percentages

This is how Erasmus MC uses FlexWhere office analytics

"FlexWhere is useful for both users and management in our hospital"
"FlexWhere is an excellent tool for keeping the costs of healthcare housing in check."
Huib Maclean
Strategic advisor housing
Start with FlexWhere today
14 days free
No payment details needed
Try with colleagues
Access to all features
Customised to your office
What are you looking for?
Aside from our office analytical features, we offer awesome desk booking and meeting room booking software ! Check it out below