Eddy
Eddy
Statistics in the Dashboard
Organizations that have the Pro or Enterprise license can use the Flexwhere Dashboard.
The Dashboard gives organizations insight into the use of Flexwhere in their organization in multiple ways.
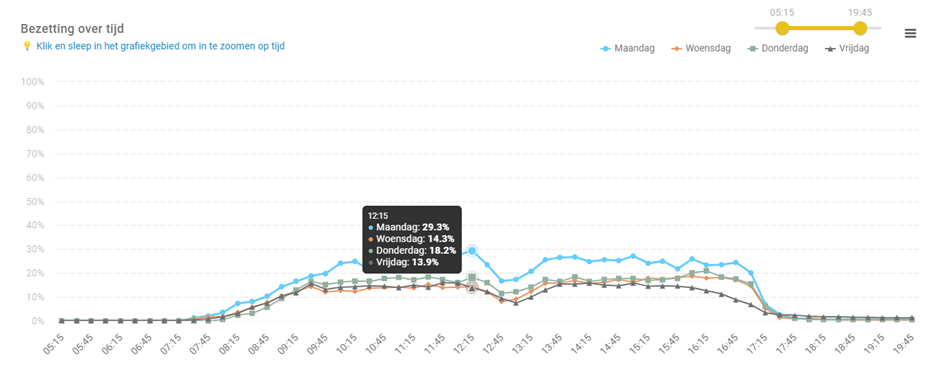
Occupancy over time
Flexwhere displays a graph in the Statistics tab showing the occupancy of all objects in your organization.
This graph provides a view where per 15 minutes a percentage is shown of all occupied (red) objects compared to the total number of objects present in a building and/or floor.
The occupancy percentage is calculated based on all objects that have been occupied during a 15-minute period.
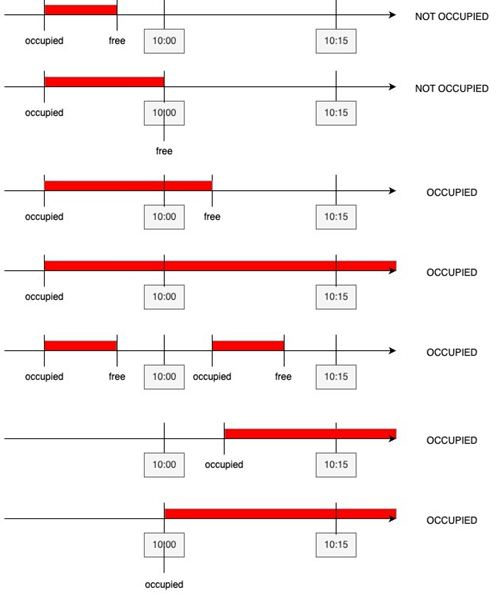
That is, when looking at time 10:00 in the graph, Flexwhere shows there a percentage of the number of objects that were occupied during the time period from 10:00:00 to 10:15:00.
The image below shows a visual representation of when an object is or is not given as occupied:
The filter options at the top of the page allow you to refine the results to your liking. Among other things, you can filter on 1 or more floors, different objects or on different days.

When a period of one day is selected, the actual object occupancy for that day will be shown.
When a longer period is selected, an average of that day’s occupancy will be shown over the selected period.
By clicking on the 3 dashes at the top right of the graph, different export options can be selected.